Ask any hospital COO or clinical director for performance data, and you will receive binders full of green KPIs:
- Registration: 95% on-time check-in
- Consultation: 96% completed on schedule
- Laboratory: 98% first-pass sample acceptance
- Radiology: 97% report turnaround compliance
- Pharmacy: 95% prescription fill accuracy
- Follow-up: 96% appointment booking compliance
On paper, the hospital is thriving. Every department head hits their quarterly targets, the dashboard looks immaculate, and operational reviews run smoothly.
Yet patient complaints persist. Waiting rooms stay crowded, clinical staff battle chronic rework, and patient experience scores plateau.
The disconnect stems from a fundamental blind spot: hospitals measure departments, but patients experience the system.
When care delivery is managed as a series of isolated kingdoms rather than a continuous flow, leadership falls into the trap of local optimization. To see what the patient actually endures, healthcare leaders must borrow a foundational principle from process engineering: Rolled Throughput Yield (RTY) in Healthcare systems.
Why Rolled Throughput Yield in Healthcare Exposes Silo Failures
Traditional healthcare metrics rely on departmental yields—the percentage of units (or patients) that pass through a single department without a defect.
The flaw in this approach is that individual yields are non-cumulative. A patient does not reset their journey when they leave the doctor’s office and walk into the phlebotomy lab. Every defect, delay, repeated question, rejected sample, or missing chart item accumulates along their path.
RTY measures the probability that a process will pass through an entire sequence of steps Right First Time (RFT), without rework, defects, or unnecessary delay.
Mathematically, RTY is the product of each sequential step’s yield:
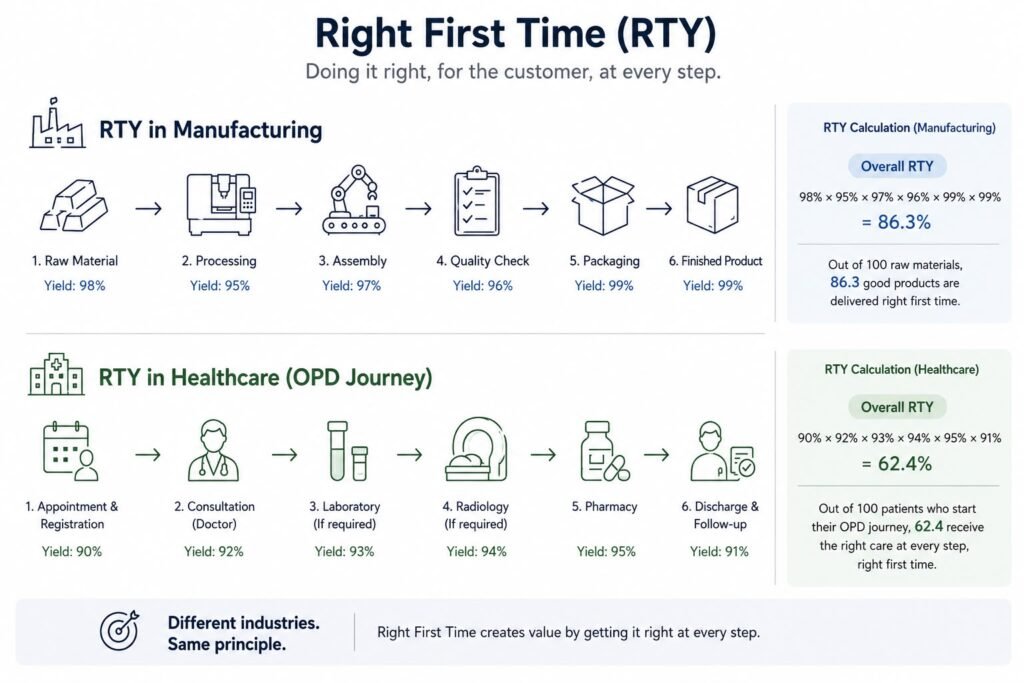
Consider a routine Outpatient Department (OPD) pathway involving six touchpoints:
| Stage | Process Touchpoint | First-Time Right Yield | Common Hidden Defects / Rework |
| Step 1 | Appointment & Registration | 90% | Insurance pre-auth delays, mismatched demographic data |
| Step 2 | Clinical Consultation | 92% | Incomplete clinical history, missing vitals, rework in ordering |
| Step 3 | Diagnostic Laboratory | 93% | Hemolyzed samples, mislabeled tubes, redraw requests |
| Step 4 | Diagnostic Radiology | 94% | Improper patient prep, scheduling overlap, re-scans |
| Step 5 | Outpatient Pharmacy | 95% | Out-of-stock items, illegible dosing, insurance rejection |
| Step 6 | Discharge & Follow-up | 91% | Unclear discharge instructions, missed booking slots |
Viewed in isolation, these yields appear acceptable—no single department drops below 90%.
Now calculate the actual patient journey:
The end-to-end RTY is just 62.4%.
Out of 100 patients entering the facility, only 62 make it through their care pathway without experiencing a defect, rework, or delay. The remaining 38 patients face systemic friction: a redraw, a second wait at the pharmacy desk, or a missing radiology report that holds up the doctor’s review.
Local Optimization Creates Global Failure
When a department focuses exclusively on its own scorecard, it often achieves high departmental efficiency by shifting friction onto upstream or downstream teams—and ultimately onto the patient.
- Registration hits throughput quotas by rushing patient intake, leaving missing insurance details that cause claim delays at pharmacy checkout.
- Clinicians move quickly by entering shorthand orders, forcing nursing and lab staff to spend 15 minutes clarifying intent.
- Laboratories report low turnaround times by batching samples, creating sudden operational bottlenecks in the treatment rooms.
Every department met its internal target. The patient, meanwhile, spent four hours on an appointment that should have taken ninety minutes.
Fixing this dynamic requires a shift from departmental governance to value-stream governance.
How to Start Measuring Rolled Throughput Yield (RTY) in Healthcare
Shifting toward an RTY model does not require an overhaul of your hospital information system (HIS). It requires redefining what constitutes a “defect” from the patient’s perspective.
- Map the Value Stream: Pick one high-volume patient pathway (e.g., Routine OPD, Same-Day Surgery, or Emergency-to-Inpatient Admission). Map the touchpoints exactly as the patient navigates them.
- Define “Defect” Standard: In manufacturing, a defect is a flaw in the part. In healthcare, a defect is any friction that prevents immediate, correct execution: missing consent forms, redrawn samples, medication clarifications, or re-entered intake forms.
- Capture First-Pass Yield at Each Gate: Measure how many patients pass through each step without rework or deviation. If a patient must stop and wait because an order was sent incorrectly, that step failed its first-pass check.
- Calculate and Track RTY: Multiply the first-pass yields across the pathway. Treat this overall percentage as an executive-level performance indicator alongside margin, clinical safety, and patient satisfaction.
The Executive Question
If your board asks today: “How efficient is our hospital?”, the answer cannot merely be a list of departmental averages.
A hospital is not an assembly of independent clinics operating under a shared roof; it is a single, interconnected clinical system. As long as performance is evaluated through isolated silos, leadership remains blind to the real patient experience.
What is your hospital’s true RTY—and do you have the tools in place to measure it?