Cp (Capability Index), Cpk (Process Capability Index), Pp (Performance Index), and Ppk (Process Performance Index) are key statistical tools used to evaluate the capability and performance of processes. These metrics help determine whether a process can meet specified requirements and how well it is performing in real-world conditions.
Process Capability Index – Key Differences:
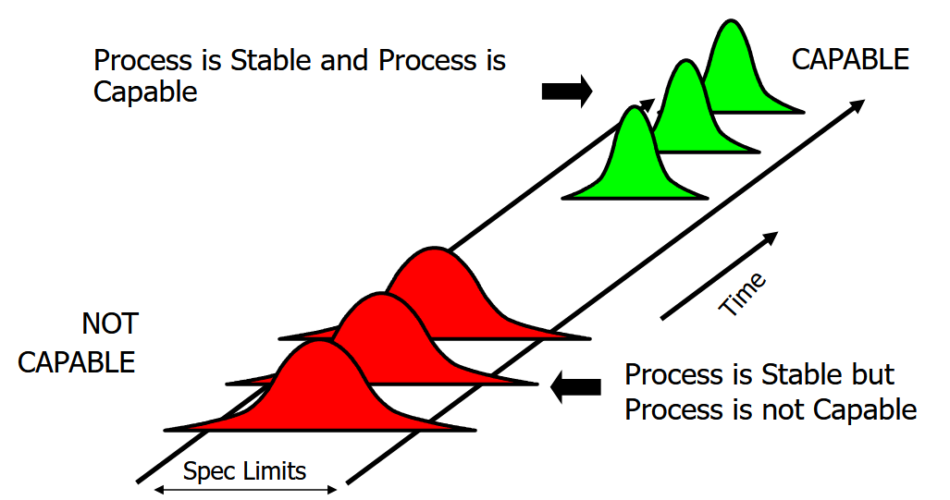
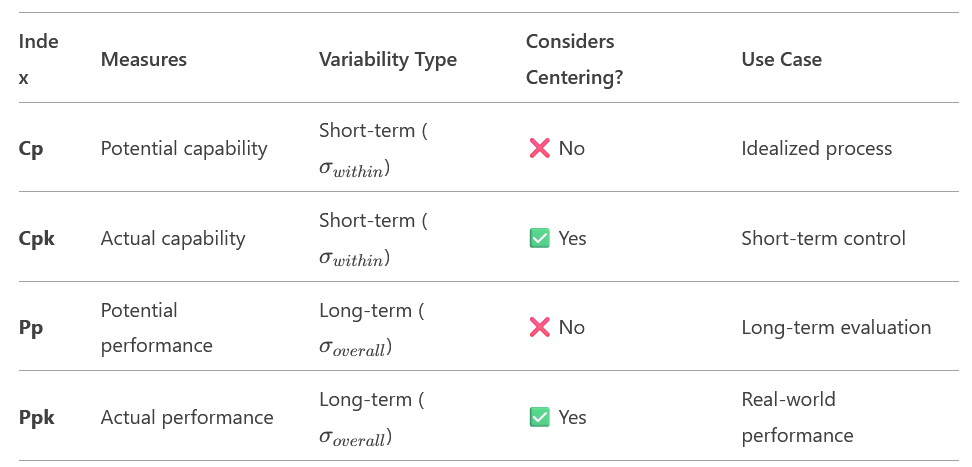
- Cp and Cpk: Measure the potential capability of a stable process.
- Pp and Ppk: Reflect actual performance, including all variations, over time.
Why Are They Used?
In hospitals, these indices are critical for assessing processes such as discharges , ER wait times, and lab result turnaround times, helping identify gaps and drive improvements.
- Cp Measures the potential capability of a process to produce output within specification limits (USL , LSL) , assuming the process is stable and perfectly centered
- Cpk Measures actual capability by considering both process spread and centering relative to specifications
- Pp Similar to Cp but uses overall standard deviation (long-term variability). Measures long-term capability using total variation (includes both within-subgroup and between-subgroup variation)
- Ppk Like Cpk but uses overall standard deviation (long-term).
Example: Patient Discharge Time
Scenario Details:
- Target Specification: The hospital aims to discharge patients within 2 hours of the doctor’s discharge order.
- Upper Specification Limit (USL): 2 hours.
- Lower Specification Limit (LSL): Not applicable (discharge earlier than 2 hours isn’t an issue).
Assume we collected discharge time data (in hours) from two scenarios:
Short-term (within-subgroup) data (for Cp & Cpk)
- Mean (μ) = 1.8 hours
- Within-subgroup Std Dev (σwithin) = 0.2 hours
Long-term (overall) data (for Pp & Ppk)
- Mean (μ) = 1.9 hours
- Overall Std Dev (σoverall) = 0.3 hours

Using Cp and Cpk (Process Capability):
The discharge process has been stable over the past month. We confirmed this by control chart.
- Cp Calculation:
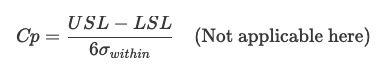
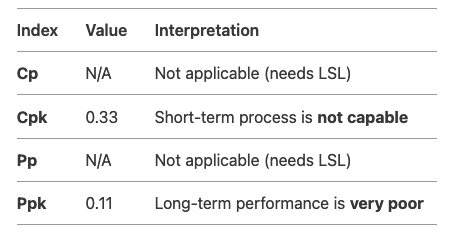
Since there’s no LSL, Cp cannot be calculated (requires both USL & LSL).
Cpk (Actual Capability, Short-Term)
With only USL, Cpk simplifies to:
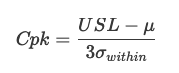
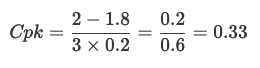
Interpretation
- Cpk=0.33<<1 → Process is not capable.
- The mean (1.8 hours) is acceptable, but variation (σ=0.2) is too high relative to the USL.
Using Pp and Ppk (Process Performance):
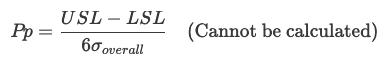
Pp (Process Performance, Long-Term)
Like Cp, Pp requires both USL & LSL, so it’s not applicable here.
- Pp Calculation:
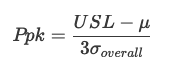
Ppk Calculation:
With only USL, Ppk simplifies to:
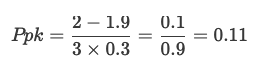
Interpretation:
- Ppk=0.11<<1 → Long-term performance is poor.
- The mean drifted to 1.9 hours, and long-term variation (σ=0.3) is even worse.
Summary of Results
Conclusion & Recommendations
- The process fails to meet the 2-hour discharge target consistently.
- Short-term (Cpk): Reduce variation (σwithin) to improve capability.
- Long-term (Ppk): Address systemic issues (e.g., staffing, workflow) causing drift (μ ↑) and increased variability (σoverall ↑).
Summary of Applications in Healthcare
- Cp and Cpk:
- Useful during stable operations to evaluate potential capability.
- Highlight whether processes are capable and well-centered.
- Pp and Ppk:
- Reflect real-world conditions, including variations due to system changes, staffing, or patient volume.
- Help assess how process improvements translate into performance.
Insights:
By analyzing these indices, hospitals can identify:
- Cp vs. Pp: The gap between potential and real-world process variability.
- Cpk vs. Ppk: The impact of process centering and stability on patient outcomes.
In the case of discharge times, these indices emphasize the need to stabilize and center the process to ensure timely discharges and improve patient experience.